
![]()


DatLab

| Description | DatLab is the O2k-Software for Data Acquisition & Analysis, specifically developed for high-resolution respirometry with the Oxygraph-2k.
The newest DatLab version is included in the O2k-Core, and updates of DatLab are free of charge during the warranty period of the O2k. |
|---|---|
| Product ID | 20700 |
| Type | O2k, O2k-Core |
| Link | Previous Product ID 28001-44, DatLab @OROBOROS |
| Image |
After many years of gradual change of DatLab 4 the multiple challenges from the increased use of MultiSensor applications prompted us to develop a new generation of software for the O2k: DatLab 5
Because the internal structure of DatLab 4 was becoming to inflexible for new features, DatLab 5 was completely rewritten. This required also a change in the file format for DatLab files, see "Compatibility" below. By now DatLab 5.2 offers many new features like renaming plots, changing units and linear regression for the calibration of the Amp channel and for calculating the instrumental oxygen background parameters. Please consult the DatLab Guide for a comprehensive description for versions up till DatLab 5.1. New features not yet included in the manuals are described below.
Installing DatLab 5
Get DatLab5
- From www.oroboros.at: When you are eligible to a free upgrade to Datlab5 our administration ([email protected]) will supply you with a login code. Use this code to log in at [1] and download "DL5Inst.exe" to your computer.
- Use the OROBOROS USB-Stick to install DatLab 5.
Install DatLab5 for a single O2k
- Open the directory "OROBOROS O2k-Course on HRR" on the OROBOROS USB-Stick and open the filefinder and click on "DatLab Install" to start the installation.
- You may be asked to permit the installation by the Windows operating system.
- C:\DatLab will be suggested as installation directory. Usually this will be also be the directory used by DatLab4 and you can accept the suggestion.
- Select "type of installation" = "typical" this will keep your instrument specific setting (chamber labels, calibration parameters) but may overwrite some layouts.
Known Issues: Windows 7: When selecting an alternative directory for installing DatLab (or creating a new directory by selecting a non existing directory) Windows 7 may respond with an error message. Ignore the error message and proceed.
Install DatLab5 for two or more O2ks on one Laptop
- Install two (or more) copies of DatLab in two (or more) different directories, e.g. DatLab_O2k1 and DatLab_O2k2.
- Create two or more shortcuts to the different .exe files. (the .exe files do not have to be renamed because they are in different directories). With this method you also have cleanly separated .ini files in the different directories.
Upgrading from DatLab 4 to DatLab 5
- DatLab 5 can be installed over DatLab 4 (recommended option). In this case all DatLab files will be kept, but some layouts may be overwritten.
- During the first start of DatLab 5 the information in any Datlab4.ini file in the same directory will be copied to Datlab5.ini, then Datlab4.ini will be deleted together with DatLab4.exe. The new executable file will be Datlab5.exe. A new desktop shortcut will be created, named "Oroboros DatLab". It may be necessary to manually delete any old shortcuts (icons) to Datlab4, if present.
If for some reason you want to use DatLab4 and DatLab5 on the same computer they have to be installed in two different directories.
New Features in DatLab 5.2 not yet included in the Manuals
- Menu [O2k-Multisensor]/[Calibration] The Amp channel can now be calibrated using a multiple point linear regression:
- Select the Amp plot to be calibrated as active plot.
- Mark sections of the experiment for which the concentrations are known.
- Open the calibration window using either [O2k-MultiSensor]/[Calibration] or F5.
- In the left panel the current calibration is shown. The right panel is used to do a new calibration.
- Choose the desired unit for the calibrated signal from the drop down menu beside "Unit".
- Select the marks you want to use for the calibration by ticking the appropriate check boxes in the right panel under the heading „Select marks“. The averaged raw signal values, times, and slopes will be displayed for the selected marks.
- Leave the check boxes beside the slope column unchecked unless calibrating an Amplex Red experiment, see Amplex_red#Calibration_with_H2O2.
- Enter the known concentrations in the column labeled "Conc".
- DatLab will perform a linear regression after each field has been edited. The results, sensitivity and R2, are displayed below the calibration table. You can compare these parameters with those of the currently valid calibration in the left panel.
- Check the quality of the calibration with „Show Graph Plot“. The graph may be exported to the clipboard.
- Apply the new calibration values with „Calibrate“ or continue using the old calibration values with „Cancel“.
Manually entering parameters from a linear regression:
- Choose the desired unit for the calibrated signal from the drop down menu beside "Unit".
- Enter the desired values for sensitivity (slope of a regression signal against concentration) and intercept.
- Apply the Calibration values with „Calibrate“ or continue using the old calibration values with „Cancel“
- Menu [O2k-Multisensor]/[Calibration]: Functions effecting the calibrated signal have been separated from those effecting the slope calculated from the signal by placing the in different tabs: “Calibration” and “Slope”.
- Menu [Experiment]/[Edit]: It now possible to calculate the parameters describing Instrumental background oxygen flux directly in DatLab:
- Perform an instrumental background test and set marks on the O2 slope plot as usually.
- Open [Experiment]/[Edit].
- Click on the “Calculate” button beside the displayed current background correction parameters for the desired chamber.
- Select the marks that should be included in the calculation of background parameters by ticking their check boxes (in a standard background experiment usually all marks will be used).
- Background parameters will be calculated and displayed immediately.
- Control the quality of the regression with “Show graph”.
- As a further quality control you may select to view a graph with the background correction already applied to the slopes. The corrected slopes should be close to zero.
- The graph can be exported using the “Copy to Clipboard” function.
- Close the graph window to return to the linear regression window.
- Apply the background correction by clicking “Save” in the linear regression window and again save in the [Experiment]/[Edit] window.
- The parameters a and b are exported whenever the button "Calibrate and copy to clipboard" is used in the calibration window. Therefore the calibration list template (available at [2]) can be used for quality control and keeping a time track of background parameters.
Compatibility with DatLab 4
DatLab 5 is downwards compatible with DatLab 4: DatLab 5 can read all files generated by DatLab 4. However, DatLab 5 will save these files always in the DatLab 5 format. Afterwards, these files will no longer be readable by DatLab 4. Therefore, we recommend doing a complete transition from DatLab 4 to DatLab 5, upgrading all computers. However, there is no need to mass convert the old DatLab 4 files. They can stay in the DatLab 4 format and will be converted by DatLab 5 when necessary. If you have to import DatLab 4.1 files into DatLab 5, please upgrade to DatLab 5.1.0.130 or higher.
DatLab Technical Service Pages
The query description has an empty condition.
Version History
DatLab 5.2
see above
DatLab 5.1.1.9
- Main menu: [Oxygraph] and [MultiSensor] were integrated into [O2k-MultiSensor]. [O2k-MultiSensor]/ [Calibration] (F5) will always open the Calibration Window for the active plot (O2, pX or Amp).
- pX: [O2k-MultiSensor]/ [Calibration] : Renaming the Amp channel, selecting units for the calibrated signal, setting a factor for the slope calculation, and calculating the slope from raw signal works now for the pX channel analogous to the Amp channel (see above).
- [O2k-MultiSensor]/ [Calibration]: When changing the selected unit for the calibrated signal, DatLab asks whether the calibration should be adjusted accordingly.
- Double clicking "Light on / Light off" in the O2k-Status line will switch on / off the chamber light.
DatLab 5.1.0.130
- Menu [MultiSensor]/ [MS Calibration] (Ctrl +F5): For the Amp channel, the user can now set the name of the plot (as it appears e.g. in axis labeling), the unit displayed in the calibrated plot, the multiplication factor used in slope calculation, and whether the slope should be calculated from the calibrated signal or the raw signal. To use these new features:
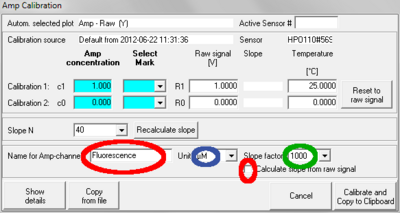
- Type the desired plot name in the field "Name for Amp-channel". Avoid long names.
- Choose the desired unit for the calibrated signal from the drop down menu beside "Unit". Default: "µM". Changing the unit will not (in DatLab 5.1.0.130) change the calibrated values. Therefore, to avoid confusion, the unit should be chosen before performing a calibration or upgrade to DatLab 5.1.1.7, see below.
- Choose the desired factor for slope calculation from the drop down menu beside "Slope factor". Default: 1000. The correct unit for the slope will be set by DatLab depending on the chosen unit for the calibrated signal and the factor for slope calculation. Changing the factor will recalculate the values for the slope plot correctly.
- To calculate the slope based on the raw signal, activate the checkbox "Calculate from raw signal". If viewing the raw (uncalibrated signal) it is recommended to use this option.
- Click "Calibrate and Copy to Clipboard" to apply all changes.
- Menu [Oxygraph]/ [Stirrer test] (F9) opens a window to enter the desired duration of a Stirrer test (Default: 30 s). After clicking "OK", stirring will be deactivated in both chambers and reactivated after the chosen time.
- Indicator for light in chambers: If the chamber light (not to be confused with light sources for fluorescence) is on, this is indicated in the status line by the text "Light on", highlighted in yellow. If the light is off the text reads "Light off", with no highlighting. This should be helpful when the chamber light is not obviously visible due to Fluorescence-Sensors inserted into the O2k front windows.
- Menu [Oxygraph]/[O2 Calibration] (F5): If the the values for R1 and R0 differ by less than 1 V a warning is displayed. This typically happens when either the same mark is chosen for R1 and R0 or when the two marks for R1 and R0 are set erroneously to the same "state" of the chamber, that is both regions are either for the "open chamber" or for the "closed chamber, no oxygen" state. Check the selected marks when seeing this warning. It is possible to ignore the warning and continue with "Calibrate and Copy to Clipboard".
- Menu [Oxygraph]/ [O2k Control] (F7) / [Configuration]: A field "pX Reference Electrode" was added. A serial number or other designation can be entered.
- Menu [Experiment]/ [View protocol] (Ctrl+F3): The information is now more clearly structured to discern between parameters used during a calibration (may originate from another file, different condition) and the parameters used when the file was recorded. Both, calibration information and the information about actually used parameters were expanded for the pX and Amp channels.

DatLab 5.1.0.20
- DatLab 5 supports connecting the oxygraph to a computer via the computers USB port and a standard USB cable (requires O2k-Core or O2k Series E and above). Additionally, DatLab 5 still supports connection to a computer via the RS232 port. Therefore, it is possible and highly recommended to upgrade all oxygraphs in a lab to DatLab 5. When connecting to the O2k for the first time, the type of connection (USB or RS232) is set by radio buttons. When connecting via the USB port any detected oxygraphs will be identified by their serial number and can be selected in the drop down menu to the right of "USB Port". When connecting via the RS232 port the proper serial port "Com..." can be selected in the drop down menu to the right of "Serial Port".
- DatLab 5 allows to open DatLab files by double clicking them in the Windows file manager or similar programs. First time use: Double click any DatLab file in the Windows file manager, select "open this file type always with this program", select "browse", then navigate to the file Datlab5.exe. Usually this file will be in C:\Datlab\DatLab5.exe. Depending on your Windows settings the extension '.exe' may not be displayed: In this case you can differentiate between DatLab5.exe and DatLab5.ini by right clicking and selecting "properties". The exact procedure will depend on the version and language of your Windows operating system. After doing this once, Windows will always use DatLab 5 to open DatLab files.
- Menu [Graph]/[Scaling] (F6): It is possible to set the maximum value for the Y axis of a plot. When changing one or two parameters (minimum, maximum, or range) the remaining parameters will be adjusted automatically after pressing "OK" or clicking in a different field. Fill out only the fields Minimum and Range to simulate the behavior of DatLab 4.
- Menu [Graph]/[Scaling] (F6):It is possible to selectively copy scaling settings to other windows by using the "Apply to Graph 1", Apply to Graph 2", etc buttons. These buttons replace the "Apply to all" button. This will be helpful in MultiSensor applications when e.g. two windows should show oxygen plots (with identical scaling) and two windows should show fluorescence plots (with identical scaling).
- The number of points used for slope calculations can now be changed for the pX and the Amp channels. Select [MultiSensor]/[MS Calibration]: Slope N: Select the number of data points (N = 40 to N = 5 in intervals of 5) used to calculate the slope. A high value of N yields a highly smoothed curve, whereas a low value of N improves time resolution.
- The slopes for the pX and Amp channel are now calculated with the correct sign for the first order time derivative. That is, if the calibrated signal decreases the slope will have a negative sign, if it increases the sign of the corresponding slope will be positive. The slope for the O2 channels is still calculated to give a positive sign for a decreasing signal, signifying a "positive " respiration.
- Proton production rates can be calculated on line. In the menu select [Plots]/[Proton Flux], see O2k-pH ISE-Module.
- The amperometric channel that, due to its main use for "NO electrodes", was labeled "NO" in DatLab 4 was renamed to "Amp" to reflect its versatile nature. It is used e.g. to record the data from the O2k-Fluorescence LED2-Module.
- Faster processing of DatLab Data (this required a larger minimum file size).
