File:TMRM Fig 1.png
From Bioblast
Size of this preview: 800 × 461 pixels. Other resolution: 900 × 519 pixels.
Original file (900 × 519 pixels, file size: 14 KB, MIME type: image/png)
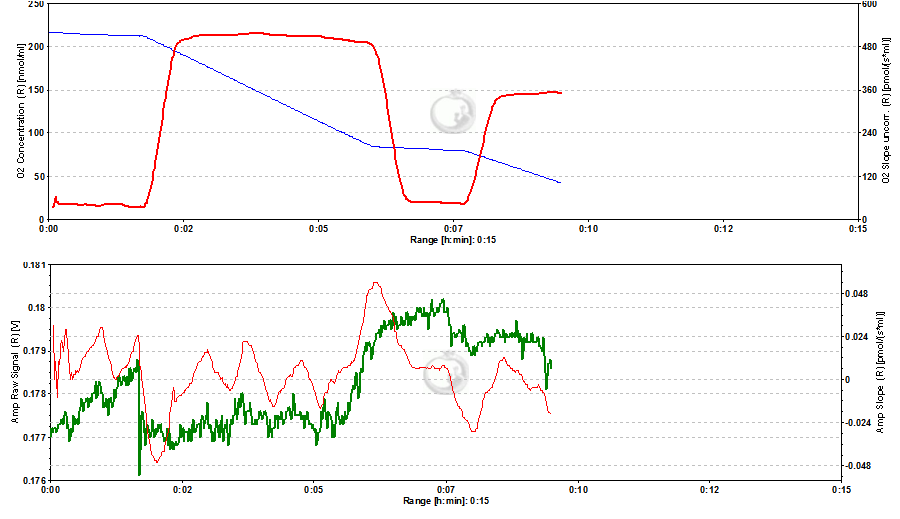
Figure 1. Zero nM TMRM. Control measurement of MLM in the absence of TMRM showing control respiratory rates (A; blue line: oxygen concentration, red line: oxygen flux) and background fluorescence (B; green line: raw signal of fluorescence, red line: rate of change in fluorescence). The maximum change in fluorescence induced by addition of chemicals amounts to approx. 0.003 fluorescence units (FU) (∆=0.003 FU).
File history
Click on a date/time to view the file as it appeared at that time.
| Date/Time | Thumbnail | Dimensions | User | Comment | |
|---|---|---|---|---|---|
| current | 14:40, 11 March 2014 | | 900 × 519 (14 KB) | Krumschnabel Gerhard (talk | contribs) | Figure 1. Zero nM TMRM. Control measurement of MLM in the absence of TMRM showing control respiratory rates (A; blue line: oxygen concentration, red line: oxygen flux) and background fluorescence (B; green line: raw signal of fluorescence, red line: rate |
You cannot overwrite this file.
File usage
The following page uses this file: